
3 in 1
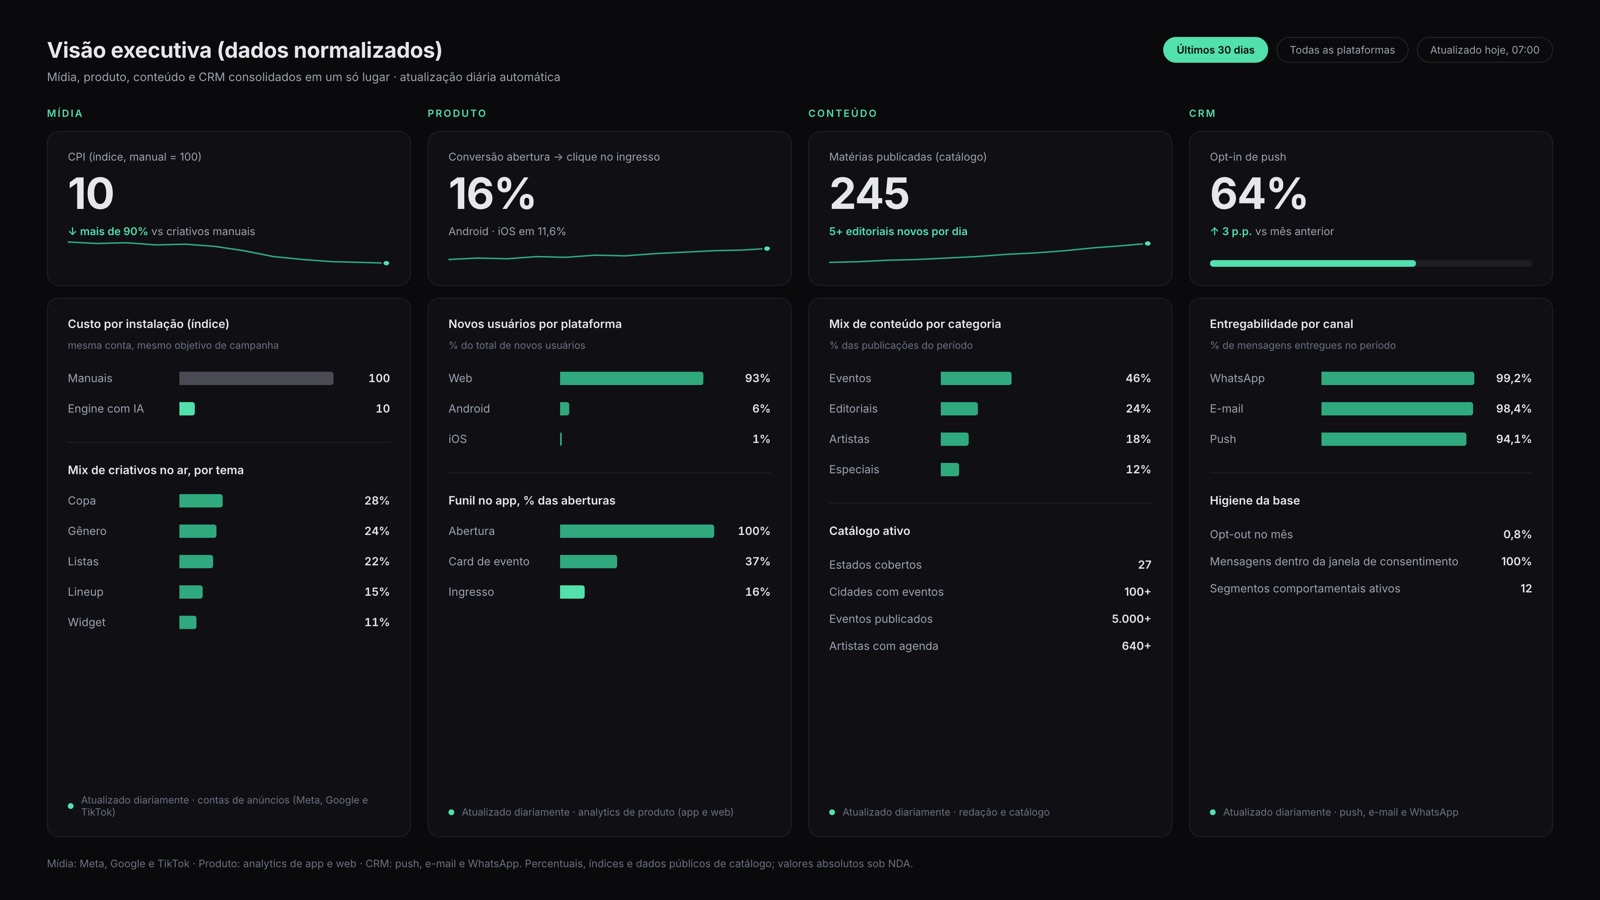
Media, product and content from FESTAS, our own product, consolidated into a single executive dashboard. It's the proof we show running live, not a slide.
Media, product, CRM and revenue consolidated into executive dashboards that refresh every day and flag anything that drifts off pattern. Proven on our own product.
You make budget calls by juggling four ad manager tabs and a spreadsheet someone forgot to update.
Every team reports a different number for the same metric, and meetings turn into debates about whose spreadsheet is right.
The executive report eats hours of someone's week and still lands stale on the decision maker's desk.
Anomalies like a CPA spike or a sudden conversion drop only surface at month-end close.
Leadership wants a single view of media, product, CRM and revenue, and today it simply doesn't exist.
You already own the tools (ads, analytics, CRM); what's missing is getting their data to talk to each other.
We map your data sources (media, product, CRM, revenue) and define together the metrics that drive decisions, not vanity numbers.
We connect the sources, normalize naming, currencies and time zones, and consolidate everything into one model with a single definition per metric for the whole team.
We design views per audience: an executive summary for leadership, operational views for media and product. Browser-based, nothing to install.
The dashboard refreshes itself daily and fires anomaly alerts whenever a critical metric drifts outside its expected range.
3 in 1
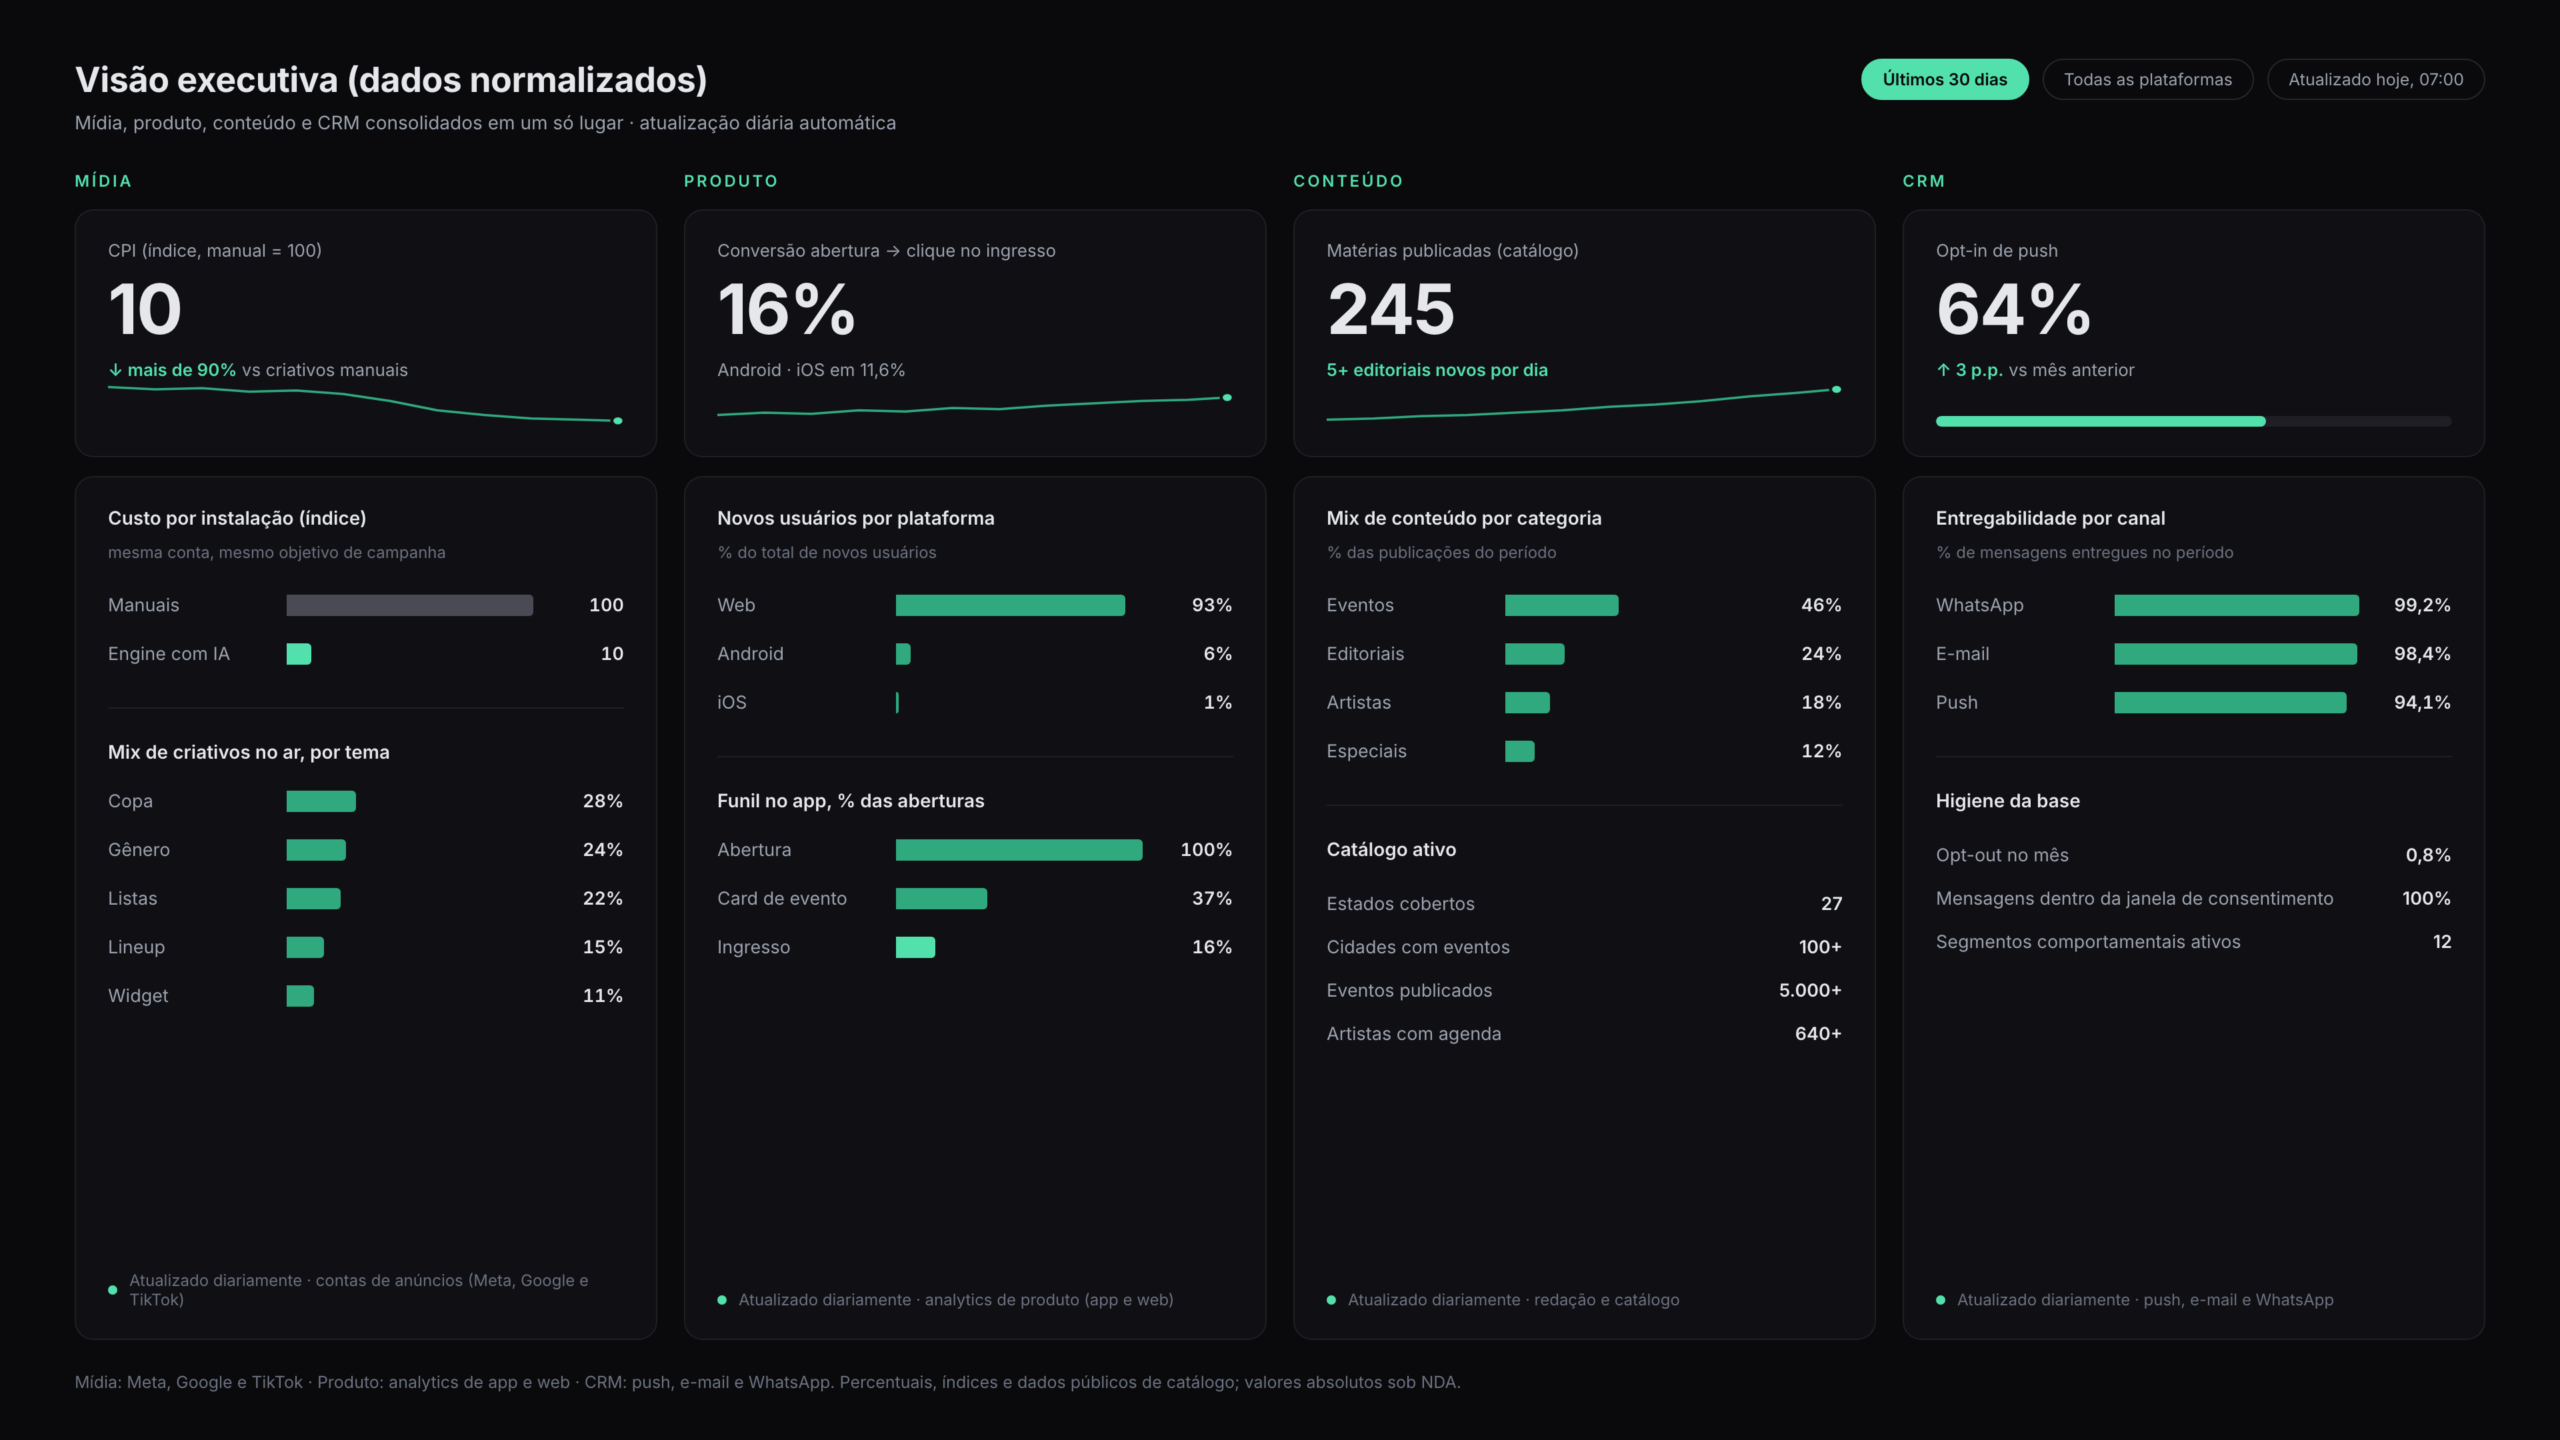
Media, product and content from FESTAS, our own product, consolidated into a single executive dashboard. It's the proof we show running live, not a slide.
100%
End-to-end automation at FESTAS: the dashboard refreshes itself every day, with no manual step between the data and the read.
1
A single data model at FESTAS: normalized naming and one shared metric definition across media, product and content.
Your business already produces every data point you need. It's just scattered across ad managers, spreadsheets, your CRM and your product analytics, each telling a different story. Our job is to pull it all into one executive dashboard that refreshes itself daily and flags anything that drifts off pattern.
3
sources (media, product and content) consolidated in the FESTAS dashboard, our own product
1
data model, with a single definition per metric for the whole team
100%
automated: daily refresh with zero manual steps
A beautiful dashboard nobody opens is a cost, not an asset. So we start from the decisions: which budget, product and CRM calls you need to make every week, and which numbers each one depends on.
The proof is our own product. FESTAS runs on an executive dashboard that consolidates paid media, in-app behavior and content performance into a single daily view. It's the same data engineering we apply to client projects.
And because a static number never wakes anyone up, we set up anomaly alerts: if CPA spikes, conversion tanks or a source stops reporting, you find out the same day, not at month-end close.
Audit: we map your sources and define the metrics that drive decisions.
Pipeline: we connect and normalize everything into one reliable model.
Dashboard: we design views per audience, from the boardroom to operations.
Automation: daily refresh plus anomaly alerts on critical metrics.
For a typical scope of 3 to 5 data sources, a working first version ships within a few weeks. We deliver in stages, starting with your most critical metrics, then iterate in short cycles on your feedback.
You do. Everything is built in your accounts or in an environment you fully control. If we part ways, the dashboard, the pipeline and the documentation stay with you, still running.
The sources are whatever you already run: ad platforms, product analytics, CRM and revenue systems. For the data and visualization layer we choose with you based on context and budget, including license-free options such as Looker Studio on top of a warehouse like BigQuery.
Fixed-scope project for the implementation, with an optional monthly retainer for maintenance and evolution. There's no proprietary license on our side, so you're never locked in.
Yes. We're async-first: written updates, recorded walkthroughs and clear documentation in English. Based in São Paulo (GMT-3), we overlap comfortably with working hours across the Americas and Europe.
Tell us which sources you run and which decisions you need to make every week. We'll come back with a dashboard scope, a phased plan and a realistic timeline.
Talk to Max MCampaign management across Meta, TikTok and Google with structured accounts, data-driven creative and CPI, CPA and ROAS optimization. Our most recent engagement cut cost per install by over 90%.
Explore serviceWe implement your full data collection layer, from in-app event to warehouse, and activate behavior-based CRM across push, in-app, email and WhatsApp. Governed taxonomy, unified identity, funnels measured end to end.
Explore serviceAI pipelines that turn one real product screenshot into 180+ ad variations, plus agents that research, write, review and publish content. For FESTAS, cost per install dropped by more than 90%.
Explore service